Shear force and bending moment diagrams are where statics stops being abstract: two simple plots that tell you where a beam works hardest and where it will fail first. They’re also where most students get stuck — not because the maths is hard, but because the method is usually taught as a pile of special cases. This guide walks through one method that works for every beam, three fully worked examples with real numbers — and here’s the part no textbook can offer: every example has a link that opens it, pre-built, in our free calculator, so you can compare your hand solution against the computed diagrams in seconds.
What V and M actually are
Cut a loaded beam at any point — mentally, with an imaginary saw — and look at one of the two pieces. For that piece not to fly off or spin, the cut face must transmit internal forces: a shear force V acting perpendicular to the beam axis, a bending moment M trying to rotate the section, and (in frames and inclined members) an axial force N along the axis. The diagrams simply plot V and M for every possible cut position along the beam. That’s all they are: a map of what the material has to resist, centimetre by centimetre.
Why bother? Because design lives on the extremes. The peak of the moment diagram decides the section size (or tells you where the reinforcement goes); the peak of the shear diagram decides stirrups and web checks. Draw the diagrams wrong, and everything downstream is wrong with them.
The two relationships that do all the work
Everything about diagram shapes follows from two small pieces of calculus:
dM/dx = V — the slope of the moment diagram equals the shear.
You don’t need to integrate anything by hand — you just need the consequences, which are worth memorising as shape rules:
| On a segment with… | Shear diagram V | Moment diagram M |
|---|---|---|
| No load | Constant (horizontal) | Straight line (sloped) |
| Uniform load (UDL) | Straight line (sloped) | Parabola |
| Point load | Jump by the load value | Kink (slope changes) |
| Applied moment | No change | Jump by the moment value |
| V crosses zero | — | Maximum (or minimum) |
That last row is the money rule: the bending moment peaks exactly where the shear diagram crosses zero. Find that point and you’ve found the critical section — no guessing required.
The method, step by step
- Find the support reactions. Take moments about one support to get the other reaction, then use vertical equilibrium (ΣFy = 0) as a check. If the loads are inclined, resolve them into components first.
- Walk the beam from the left, plotting V. Start at zero, jump up at every upward reaction, jump down at every downward point load, and slope down through distributed loads (slope = −w). You must land back on zero at the right end — if you don’t, a reaction is wrong.
- Build M from the areas under V. The moment at any point equals the area under the shear diagram up to that point. Positive area accumulates upward, negative area brings it back down. Simply supported ends have M = 0; free ends have M = 0; fixed ends don’t.
- Locate the maximum. Wherever V crosses zero, mark it, and evaluate M there. That’s your design moment.
- Sanity-check the shapes against the table above: parabolas under UDLs, kinks under point loads, closure at both ends. Thirty seconds of checking catches ninety percent of errors.
Worked example 1 — simply supported beam with a UDL
The classic: L = 6 m, w = 10 kN/m
Reactions. By symmetry each support carries half the total load: R = wL/2 = 10 · 6 / 2 = 30 kN.
Shear. Starts at +30 kN at the left support and falls linearly (slope −10 kN per metre), crossing zero exactly at midspan, x = 3 m, and reaching −30 kN at the right support. Closure: ✓.
Moment. A parabola, zero at both ends, peaking where V = 0:
That wL²/8 is the single most-used formula in beam design — worth knowing by heart.
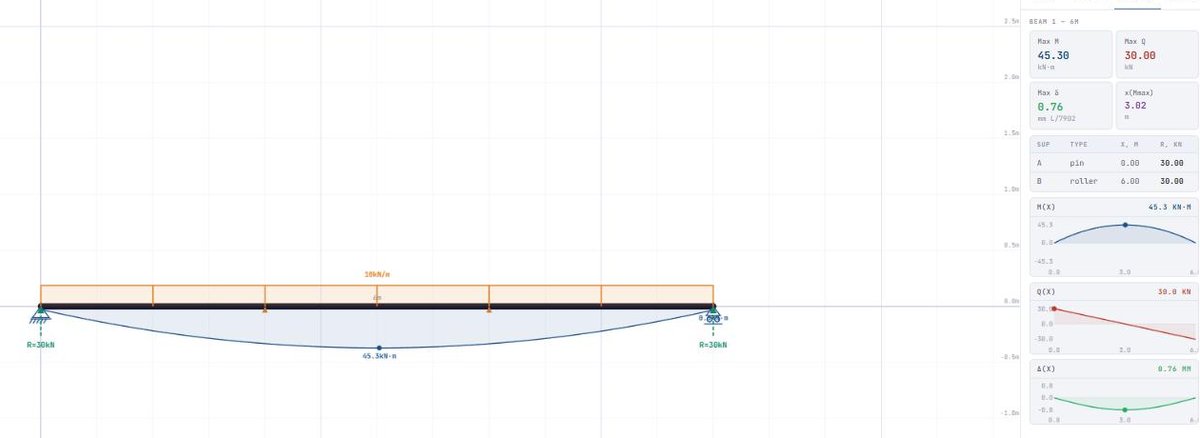
▶ Open this exact beam in the calculator
Worked example 2 — point load at midspan
L = 6 m, P = 20 kN at centre
Reactions. Symmetry again: R = P/2 = 10 kN each.
Shear. Constant +10 kN from the left support to the load (no load on the segment → horizontal line), then a 20 kN jump down at midspan to −10 kN, constant to the right support. Closure: ✓.
Moment. Two straight lines meeting in a kink under the load — zero at the supports, peak at midspan:
Compare the two examples: same span, comparable total load, but the UDL produces a rounded parabola while the point load produces a sharp triangle. Once you can see that difference coming, you’re most of the way there.
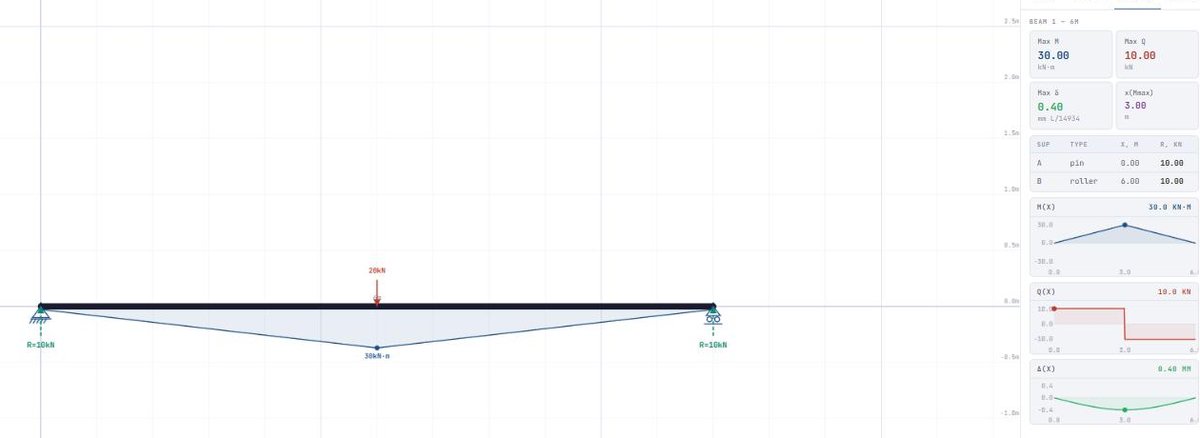
▶ Open this exact beam in the calculator
Worked example 3 — cantilever with an end load
L = 3 m, P = 10 kN at the free end
Reactions. The fixed support does everything: vertical reaction R = 10 kN and a fixed-end moment MA = −P·L = −30 kN·m.
Shear. Constant 10 kN along the whole length — one load, no distributed load, nothing to change it.
Moment. Zero at the free tip, growing linearly to −30 kN·m at the support. Cantilevers hog (tension on top), hence the negative sign — and hence why the reinforcement in a cantilever slab goes in the top.
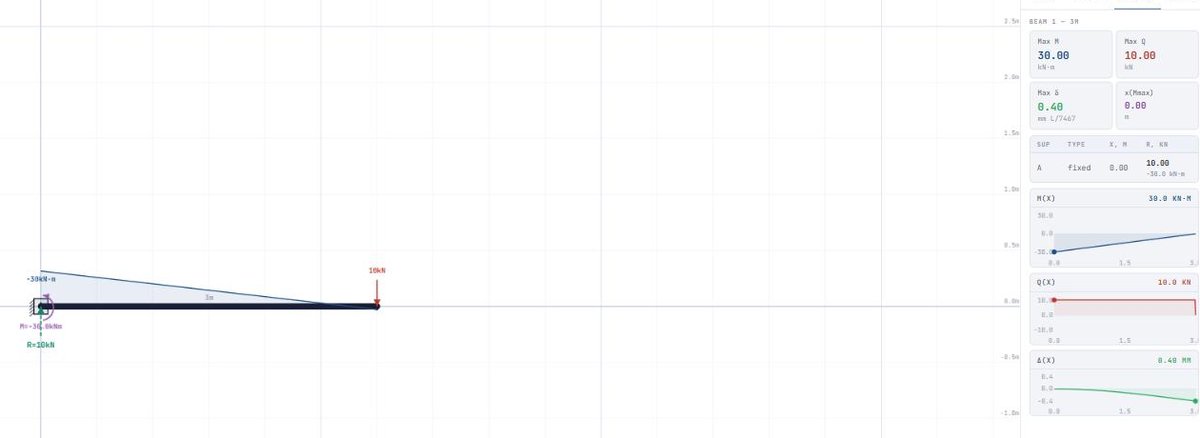
▶ Open this exact beam in the calculator
Beyond beams: the same idea on a frame
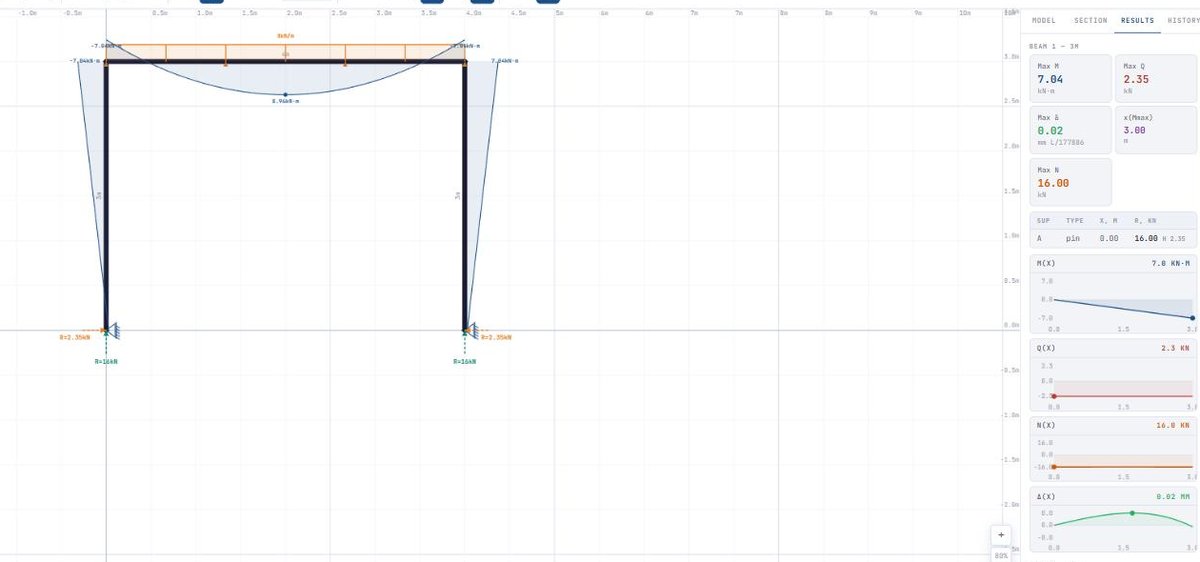
Nothing about V and M is beam-specific — a portal frame is just three “beams” welded into an н-shape, and every member gets its own diagrams (plus an axial force N in the columns, which is how the roof load gets to the ground). Doing that by hand means moment distribution or the stiffness method, which is a different article — but you can see the result right now: here’s a 4 × 3 m portal frame under a roof load, solved with the same one-click link as the beams above.
The five classic mistakes
- Wrong reactions. The most common failure isn’t the diagram — it’s step 1. Always close the shear diagram to zero as a check.
- Missing the jump direction. Upward forces push V up, downward forces push it down. Sounds trivial; costs marks every year.
- Straight lines under UDLs. A distributed load always bends the moment diagram into a parabola. A straight M-line under a UDL is a red flag.
- Reading Mmax at the wrong place. The peak lives where V = 0 — not necessarily at midspan, and not under the biggest load.
- Sign convention chaos. Sagging-positive is the common convention (moment drawn on the tension side); whatever you pick, pick once and stay with it.
Check any beam or frame — free, in your browser
The Buildref Beam & Frame Calculator draws the complete M, V and N diagrams, support reactions and deflection for beams, cantilevers and 2D frames — point, distributed and inclined loads, internal hinges included. No sign-up, no install, and you can share any model as a link (like the examples above) or export a PDF.
Open the Beam Calculator →Quick reference — standard cases
For exam revision and quick checks, these are the shear force and bending moment results for the four cases you will meet most often:
| Case | Max shear V | Max moment M | Where M peaks |
|---|---|---|---|
| Simply supported, UDL w | wL/2 | wL²/8 | Midspan |
| Simply supported, point load P at midspan | P/2 | PL/4 | Under the load |
| Cantilever, UDL w | wL | −wL²/2 | Fixed support |
| Cantilever, point load P at tip | P | −PL | Fixed support |
For load take-down, load factors and section-capacity checks that come before these diagrams, see Beam Load Calculations — Step-by-Step Guide with Formulas.
Frequently asked questions
Where is the maximum bending moment located?
What is the difference between shear force and bending moment?
Why is the moment diagram a parabola under a distributed load?
What happens to the diagrams at a point load?
Do these rules work for cantilevers and frames too?
How can I check my shear and moment diagrams?
The interactive examples in this article open in the free Buildref Beam & Frame Calculator — it runs in your browser, needs no account, and every model can be shared as a link. Related reading: Beam Load Calculations — Step-by-Step Guide and How to Resolve a Force into Components.